In my previous post on SQL, I talked about why UX researchers should learn SQL, my most used core SQL syntax, and some things you’ll run into doing SQL in the wild. I didn’t talk about exactly how to build a SQL query conceptually, so I will share my mental model here.
I first demonstrated this approach in my webinar, Data Analysis: SQL for UXRs (recording, slides). The webinar covers most of this post and my previous SQL post, but has a few extra pieces of information (more code and mental model examples, more discussion about the value of SQL, etc).
Now, onto the mental model for SQL query building.
Note: my example is UX research focused, but I imagine this approach would apply outside of the UX research domain well.
The mental model
There are a few key steps in building a query. This certainly isn’t the only way to do it, but it’s a reflection of how I get from start to finish in my projects that involve SQL. It’s an iterative process based on what data you need and what data is available.
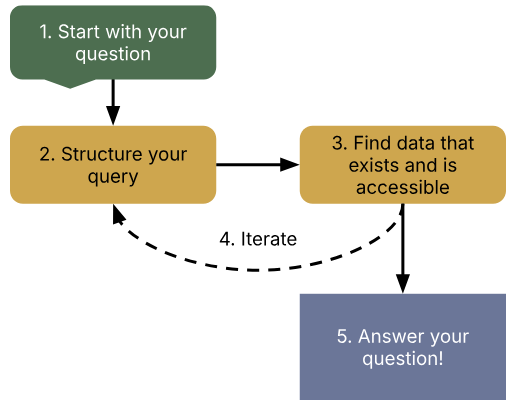
- Start with your question.
- Clearly define what you want to know, such as, “How many users are in Germany vs. Italy?” or “How many new vs. tenured users complete the order form flow on average?”. Your question might be answered entirely within SQL. You may also bring the data from SQL into R, Python, or Excel.
- You also may not exactly have a “question” if you’re pulling data for a complicated survey sample or interview participant list, but you should still have clear requirements.
- Structure your query.
- There are two major steps here, identifying the final data format needed, and working through steps of how to get to the final format.
- Identify the final format: consider what variables you need. If you want to correlate comments by users with their number of friends on Facebook, you’d need three columns: user_id, number_of_comments, and number_of_friends.
- Work through steps to get to the final format: consider what tables you’d need to get to the final format. In our above example, we might need to join a table about comments with a table about friend statistics. Only then would we have all of the data we need for our eventual analysis.
- Find data that exists and is accessible.
- Once you have a vision for your query, you need the tables of data required for it. This process of finding data is challenging. It’s a corporate maze of using the tools your company has to organize data, and then (almost) inevitably asking a human you don’t know very well about a table because the organization is filled with holes.
- Iterate on the plan based on available data.
- In the process of getting your tables, you may find they don’t exist exactly how you need them. In searching for a table with a count of comments, you just find a long-format table with each comment by each user. Your query would then need additional logic to calculate the counts. You won’t know exactly what exists until you have a need to look for it. The plan for a query can become more challenging than expected initially, this is quite normal!
- Answer your question.
- Once you have found all the data you need and/or built queries to transform the data to your needs, you can answer your question (whether in SQL or another tool)!
This approach has worked well for me. Let’s go over an example to consider how this would really work.
Example: The relationship between orders and support requests
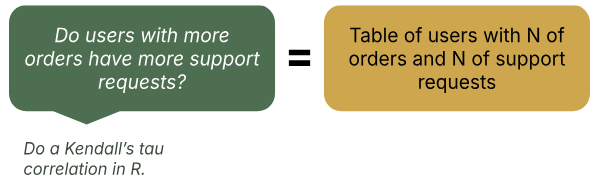
Imagine that you want to understand how support request frequency relates to the number of orders. The PM thinks they need to focus on support requests for their customers that are extremely loyal and make many orders. You have a hunch that new customers are getting blocked more than customers who order often. To dig into this, you plan to correlate the number of orders with the number of support requests in R – this correlation is a question you need to answer (step 1: research question identified). How would you get this done?
To do a correlation, you need three columns: the user_id, the count of orders, and the count of support requests (step 2a: final data format defined) .
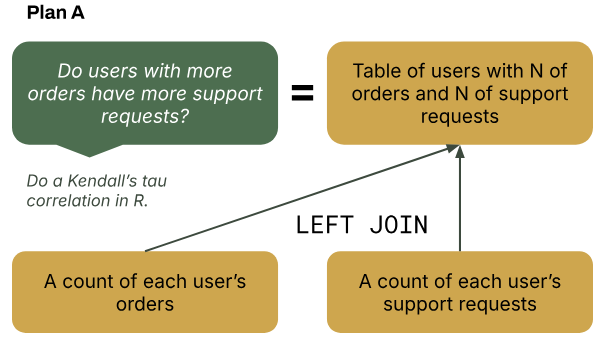
It’s pretty unlikely this table exists on its own, so you need to find order data and support request data. Each of these tables need to have the key count variable aggregated by user_id. Once you have these tables, you can JOIN the tables together to combine the columns that you need in one place for the correlation (step 2b: work backwards to get the data needed).
After some digging, these aggregate tables don’t exist. For both tables, you instead find unaggregated tables that have all individual user orders and all individual user support requests (step 3: found what data exist or not). Then, you aggregate the tables on user_id yourself by using COUNT() and GROUP BY (step 4: iterated on the query). This aggregation gets you both tables you need to do the final JOIN for your complete table.
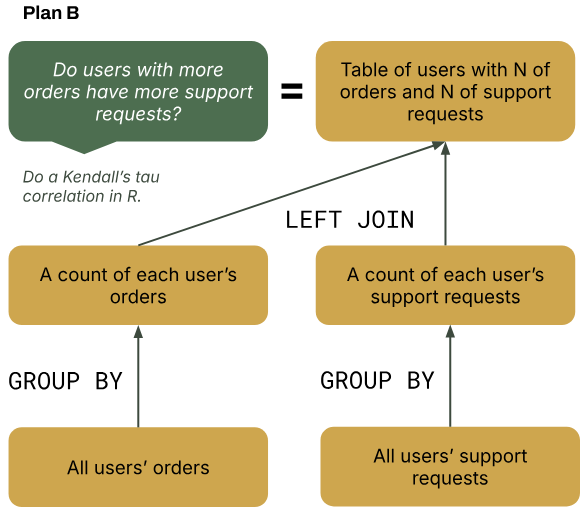
At the start, you thought plan A would get you what you needed. After digging for data, you realized that you needed to iterate on the plan to work with what data are actually available. In the end, you create the table you need and do the analysis in R (step 5: question answered).
Here’s what the code for our example would look like:
--- Aggregate the order data
WITH orders AS(
SELECT
user_id,
COUNT(order_id) AS order_num
FROM order_table
GROUP BY user_id),
--- Aggregate the support request data
support AS(
SELECT
user_id,
COUNT(support_requests) AS support_num
FROM support_table
GROUP BY user_id)
--- Join the order and support request data
SELECT
orders.user_id,
order_num,
support_num
FROM orders
LEFT JOIN support ON orders.user_id = support.user_id
I often use WITH AS to create sub-queries. This is quite common with intermediate SQL needs. It allows you to aggregate both tables from their unaggregated forms, and then join them in one query.
The iteration may continue as the project unfolds. After sharing your finding with the PM, they may bring up that this could vary by user company size (if we have a B2B product users are ordering). In this case you may add a new branch to (1) join company revenue data to the final table after (2) connecting a user_id column to another table that has the company name for each user and (3) joining the company name table to another table that has company name and its total order value in a given year. There are a few steps here, but each is doable. It’s a matter of thoughtfully connecting all the dots of what you need.
Using this mental model can help you to break down the complexity and see how to systematically add all of the pieces you need to get your question answered.
Coding effort vs. organizational effort
As I mentioned in the previous post, it can be quite effortful to locate the data you need. I get less discouraged in my SQL work when I begin projects expecting a significant portion of the work to be finding the data I need.
First, you have to locate the table. It may begin with diving into a data library, wiki page, or some other organization system. Table descriptions have varying levels of completeness. Then you have to reach out to real humans, who are busy and take a while to respond. Waiting for others to help your work can significantly extend the length of time you need to keep your motivation up. You also don’t know how close you are to finding what you need (if you will at all), so the distance to the finish line is unclear.
Eventually, when you have the table you need, you have to make sense of (1) what exactly the table actually measures and (2) how high quality it is. Some tables may be missing data from users systematically or the definition the table uses for its variable is obsolete.
I don’t say all of this to discourage you from trying SQL. I say it to make sure you know where you will get stuck and frustrated before succeeding – it won’t just be in the code itself! After you build up some experience, you can make note of your most needed tables and reuse queries. It gets much easier after some initial learning at any organization.
Using AI
AI models can be really useful for coding. They do best when you have most of the skeleton built out for what you need, and you’re having trouble with the last 10% of the logic (maybe a window function, like LAG, or PARTITION BY). They will probably fail you if you just try to input your question you need answered. The result will be simplistic or wrong.
In my experience, AI is not yet useful wholesale for finding the data you need. There are some AI tools that can speed this up, but mostly for tables you already could easily find.
Will all of this change in a few years? Maybe, but ultimately the challenge with SQL is pointing queries at the right data for your team’s problem, not writing window functions.
Wrapping up
Learning SQL is just partially about code. You need the basic syntax, and there are tons of free resources to learn it. I found that syntax tutorials didn’t give me much help in figuring out how to answer my own questions. You can learn the syntax of any spoken language, but it’s not worth much if you don’t know what you want to say. My mental model outlines the steps I use for figuring out what I want to answer with SQL and how to do it.
My mental model for SQL has 5 major steps:
- Start with your question
- Structure your query
- Find data that exists and is accessible
- Iterate on the plan based on available data
- Answer your question
When you have your syntax basics covered, try sketching out your queries like my example. It can help you break down the steps you need to figure out how to answer your questions with SQL.